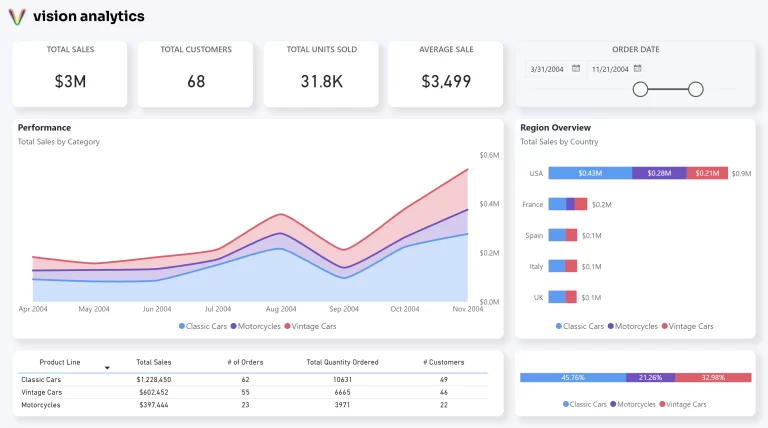
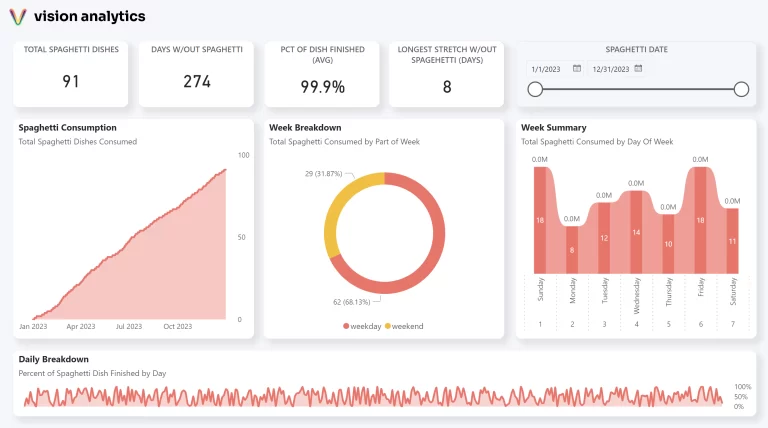
Build Fast In Power BI
The Vision Toolkit has everything you need to quickly build your next Power BI report.
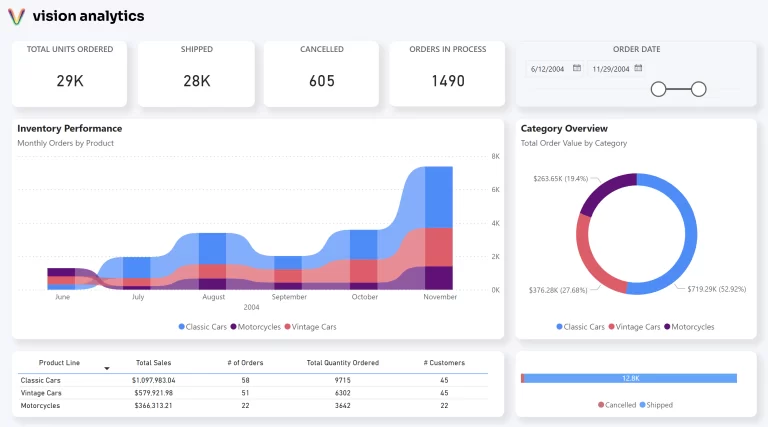
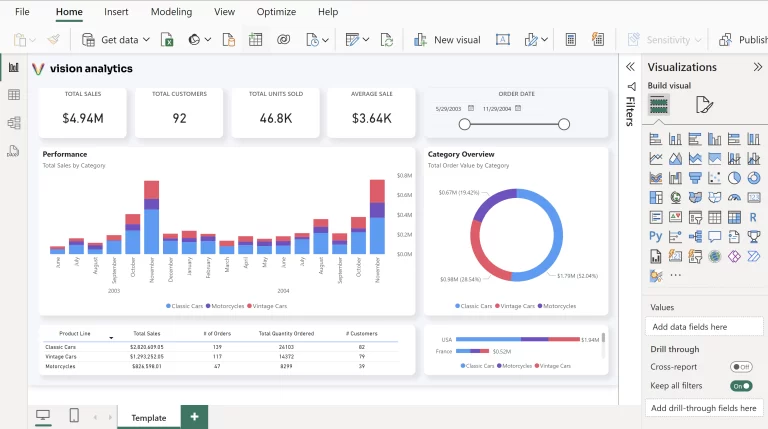
A global logistics report provides a comprehensive overview of logistics operations on a worldwide scale, offering insights into various aspects of the supply chain and distribution networks.
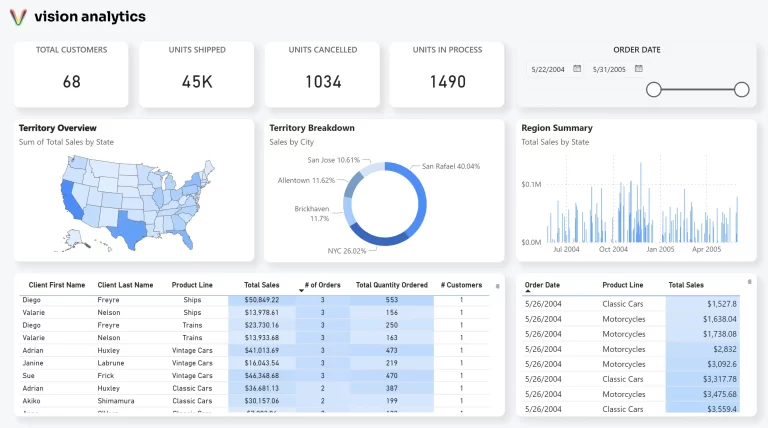
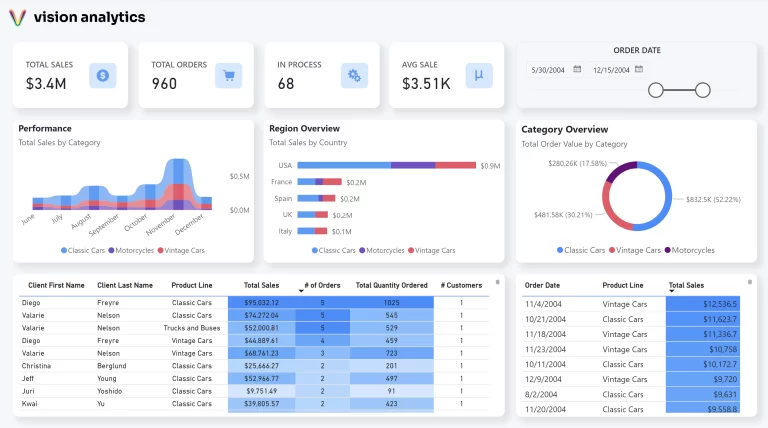
Replace your excel reporting with interactive reports. These reports are setup to be fully self-serviceable for the members in your organization.
A customer data report centralizes key metrics and insights about a company’s customer base, enabling businesses to understand their market, tailor their strategies, and enhance customer relationships effectively.
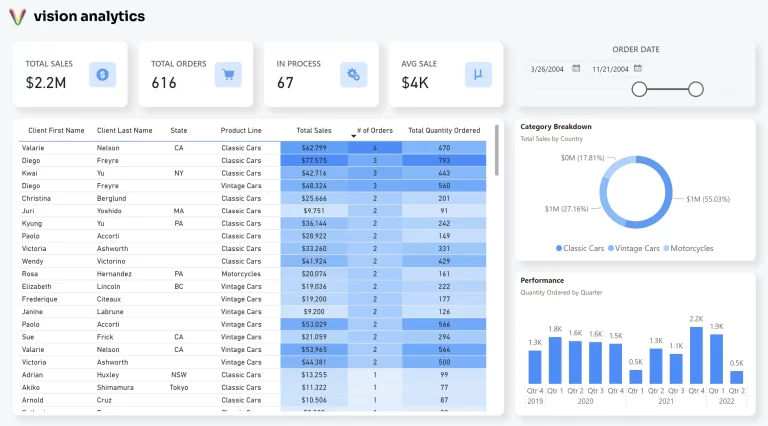
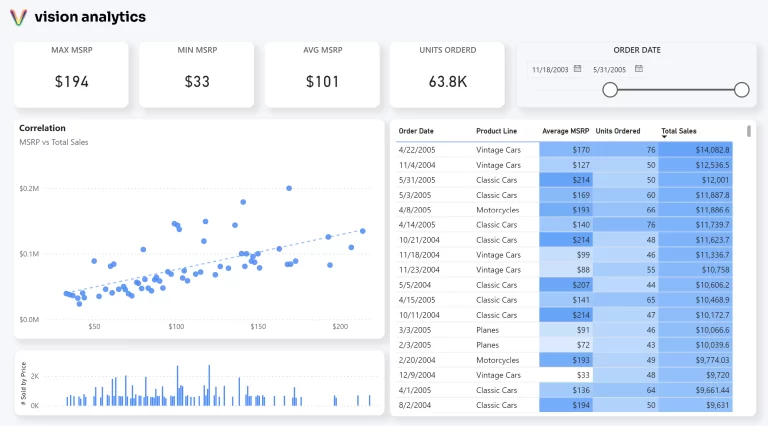
An advanced analytics report will convey correlations between two variables. In this example, the user can understand the relationship between price and sales.
Fully Built Templates
- Power BI templates designed to cater to your reporting needs right out of the box.
- Everything needed to turn raw data into actionable insights, without the need for extensive customization or design work.
Custom Visual components
- Bring your data to life with our custom visual components for Power BI.
- Tailored to fit the unique demands of your data storytelling, these components offer unparalleled flexibility and creativity in visualizing data.
- From intricate charts to dynamic visuals, our library empowers you to present data in ways that are both engaging and informative.
How It Works
Warch our video using the Vision Toolkit
Design Whitepaper
Best practices for dashboard design
Power BI Blog
View our latest posts on dashboard design